
Categories
Expert Advice, Market Insights, Purchasing, SellingPublished November 6, 2025
Prescott Arizona Real Estate Market Update: October 2025 Market Trends & What They Mean for You


Last updated: November 6, 2025
If you've been watching the Prescott Arizona real estate market lately, you've probably noticed some interesting shifts happening. The October 2025 market statistics just came in from the Prescott Area Association of REALTORS®, and they tell a fascinating story about where our local housing market appears to be headed. Let me break down what the data is showing us and what it might mean whether you're buying, selling, or just keeping an eye on your home's value.
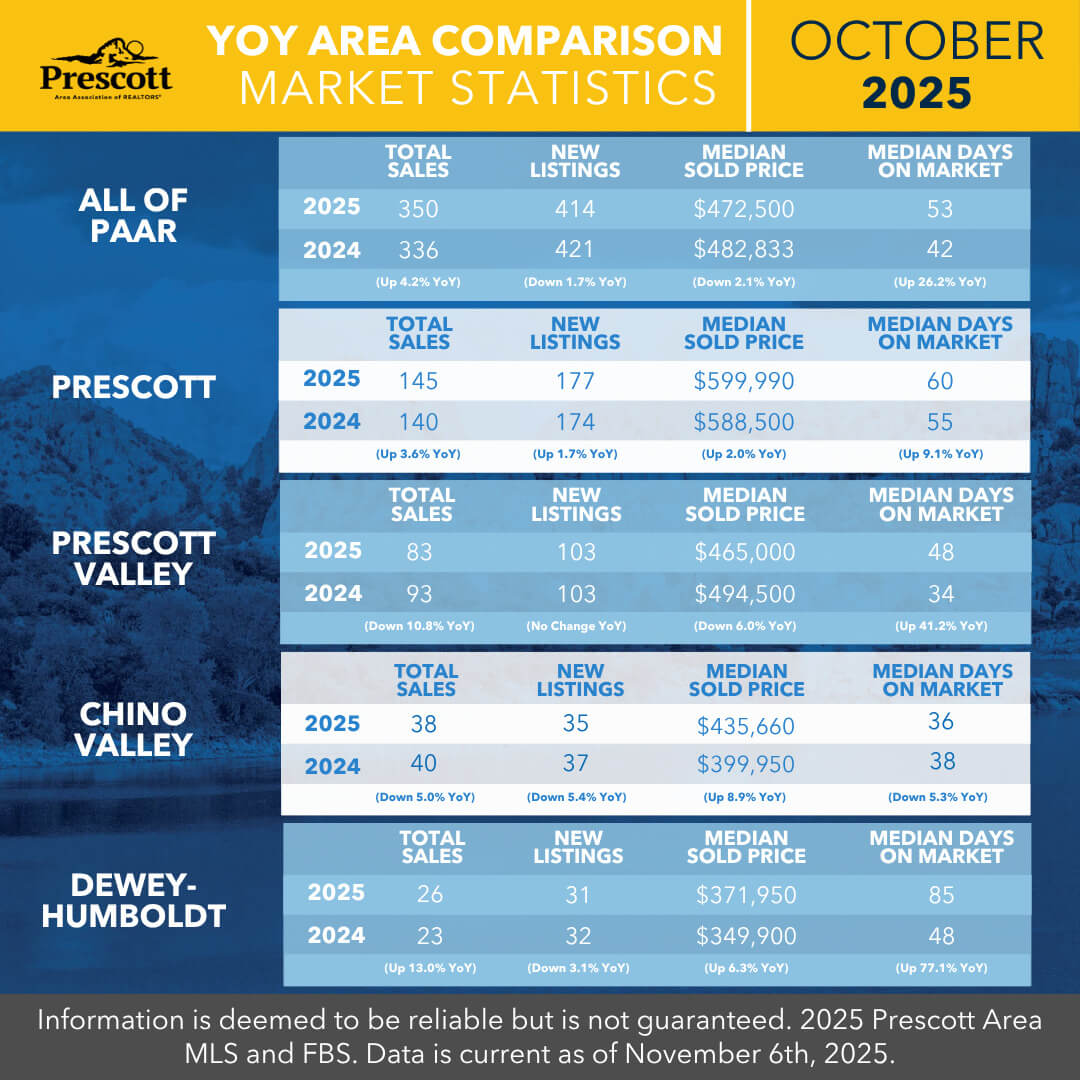
This overview graphic shows the comparison across all Prescott area markets at a glance
The Big Picture: A Market That Appears to Be Finding Its Balance
Think of the Prescott area housing market as a pendulum that's been swinging back and forth over the past few years. After the frenzy of ultra-low inventory and lightning-fast sales, we're now watching that pendulum settle into what seems to be a more balanced position. And depending on which part of the Prescott area you're looking at, the data shows that the story varies quite a bit.
Prescott Proper: Data Shows Continued Premium Positioning
The city of Prescott continues to command premium prices—and the data suggests there are good reasons for this. In October 2025, the median home price in Prescott reached $599,990, up 2% from last year's $588,500. While 145 homes sold during the month (up 3.6% from October 2024), the data indicates that buyers are taking a bit more time to make their decisions. Homes are staying on the market for an average of 60 days, compared to 55 days last year.
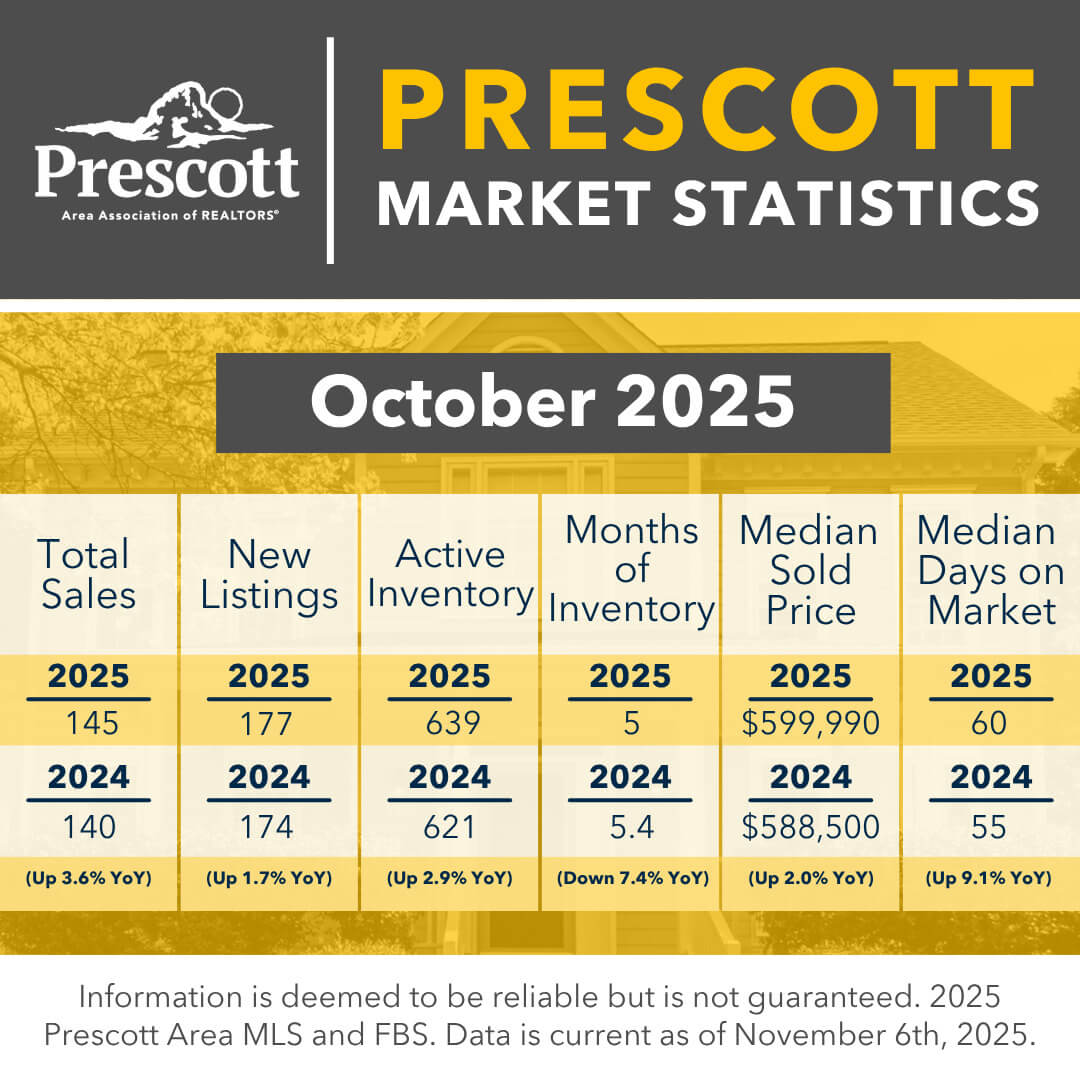
Detailed breakdown of Prescott city's market performance
What might this mean for you?
If you're selling in Prescott: Based on current trends, your home may maintain its value, but the data suggests you should expect the process to take a couple of months rather than a few weeks. Pricing strategically from the start appears to be important. Buyers seem to have more options now and the data indicates they're being more selective.
If you're buying in Prescott: The statistics suggest you may have some breathing room. With 5 months of inventory available (that's generally considered the benchmark for a balanced market), the data shows you might be able to take your time, schedule second showings, and potentially negotiate without the fear of losing out to a dozen other offers.
Prescott Valley: Data Suggests Emerging Buyer Opportunities
Here's where things get really interesting. Prescott Valley real estate data is showing what appears to be the most significant buyer-friendly shift in the entire region. The median home price in Prescott Valley dropped to $465,000 in October 2025, down 6% from $494,500 last year. Meanwhile, homes that used to fly off the market in 34 days are now taking 48 days to sell, according to the data.
With 83 sales in October (down from 93 last year) and inventory sitting at 3.8 months, Prescott Valley may be offering some of the best negotiating leverage we've seen in years.
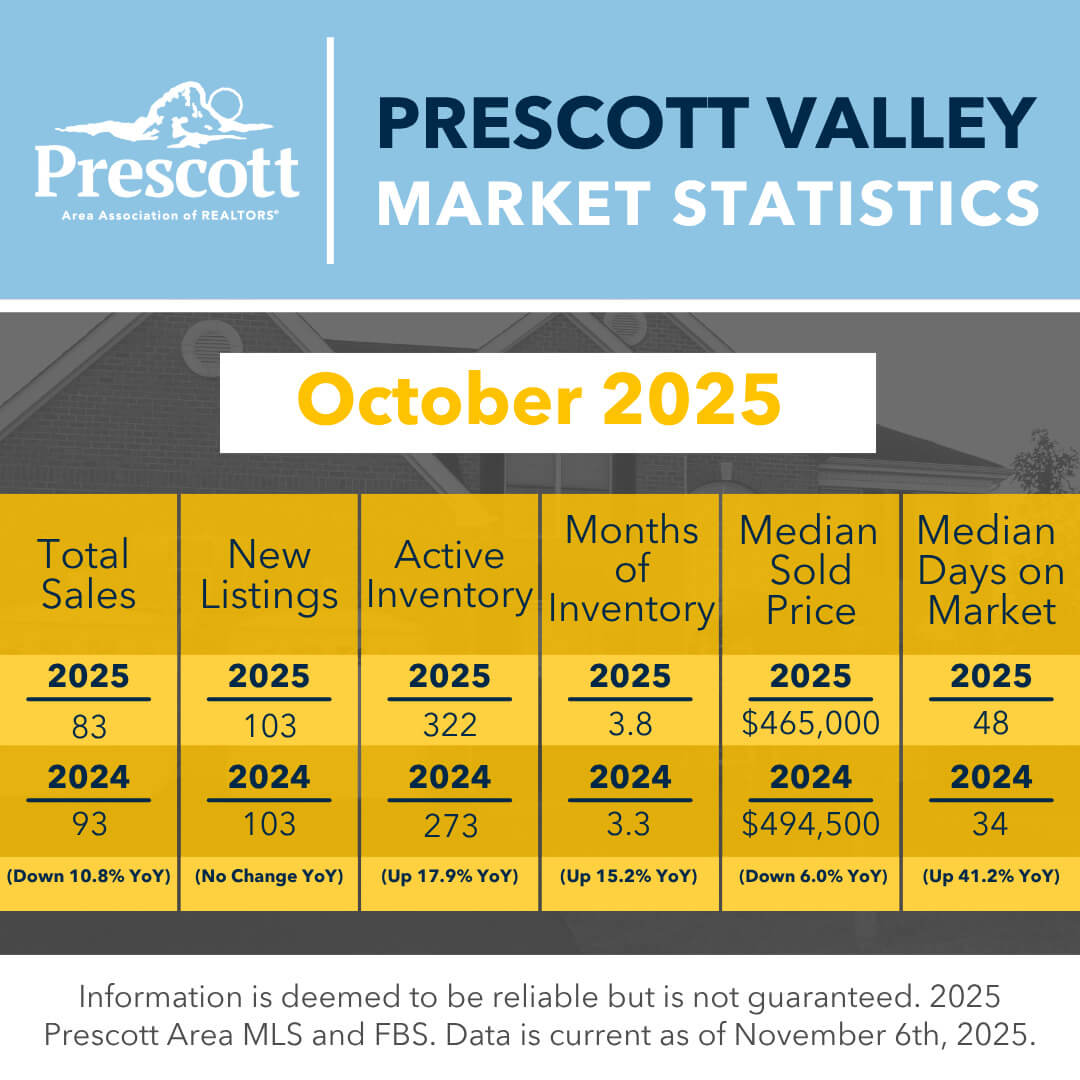
See the buyer-friendly trends emerging in Prescott Valley
If you're a first-time homebuyer or looking for value: The data suggests this could be a favorable time. Prescott Valley offers the same beautiful high-country lifestyle at a more accessible price point, and market conditions indicate that sellers may be motivated to make deals.
If you're a Prescott Valley seller: The statistics suggest partnering with an experienced agent who understands current market conditions could be beneficial. Strategic pricing and strong marketing appear to be more important than ever based on these trends.
Chino Valley: Data Points to Growth Momentum
Don't overlook Chino Valley. While it's been known as an affordable option in the Prescott area, October's numbers reveal something interesting: Chino Valley home prices jumped 8.9% year-over-year, with the median reaching $435,660.
Even better? The data shows homes here are moving faster than anywhere else, just 36 days on market. With 38 sales in October and only 4.2 months of inventory, Chino Valley's statistics suggest momentum that could attract savvy investors and buyers looking for potential growth.
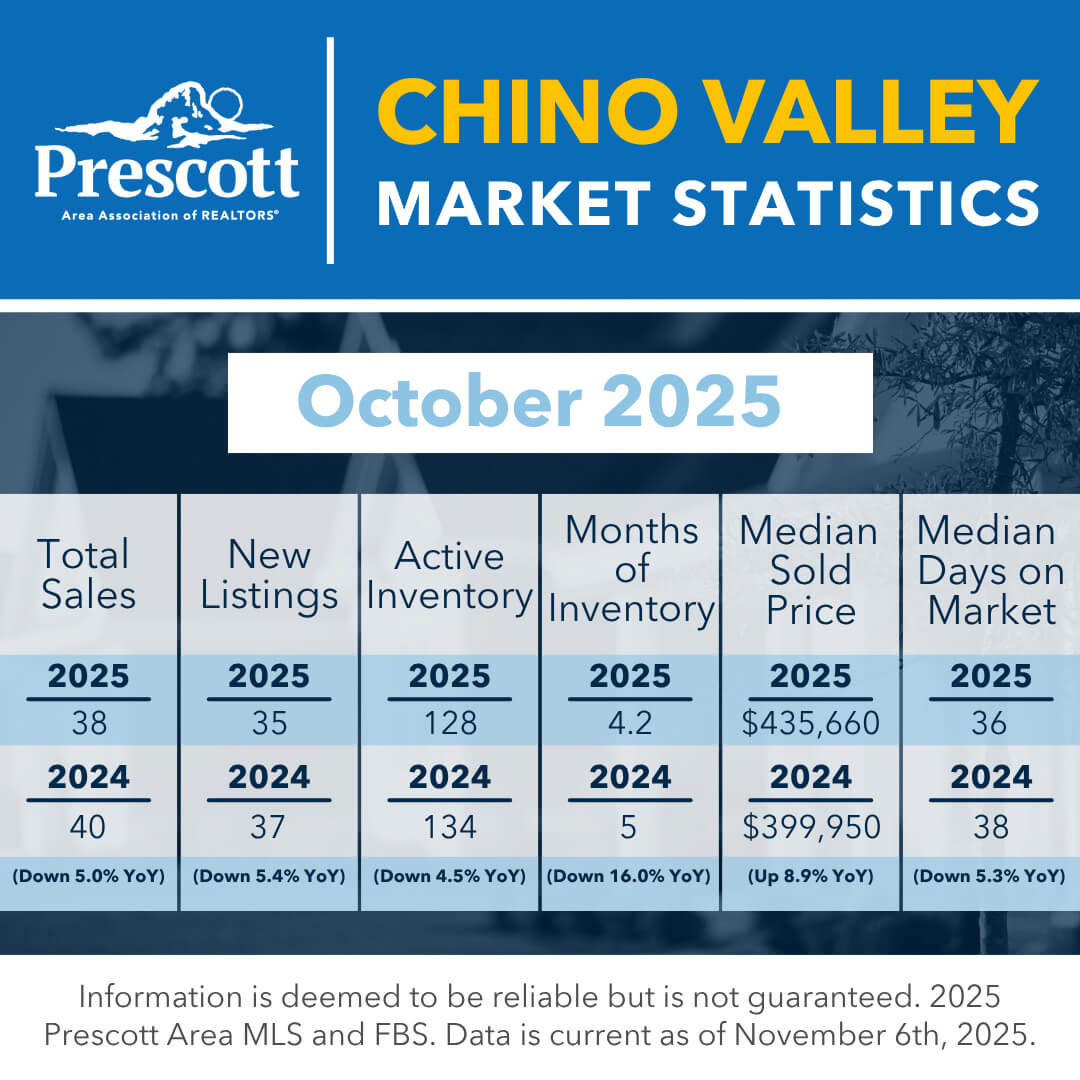
Chino Valley's impressive year-over-year price growth
The Chino Valley story: As Prescott and Prescott Valley prices push higher, the data indicates that more buyers may be discovering that Chino Valley offers exceptional value without sacrificing the lifestyle. Current trends suggest this pattern could continue.
Dewey-Humboldt: A Market Requiring Patience
Dewey-Humboldt real estate presents perhaps the most unique situation in our area. With 26 homes sold in October (up 13% from last year) and a median price of $371,950 (up 6.3%), the data shows values are climbing. But here's what's interesting: homes are taking longer to sell, 85 days on average compared to 48 days last year.
With 6.6 months of inventory, the statistics suggest this is leaning toward a buyer's market. However, for the right buyer looking for rural property, space, and privacy, Dewey-Humboldt may offer something you can't find anywhere else in the region.
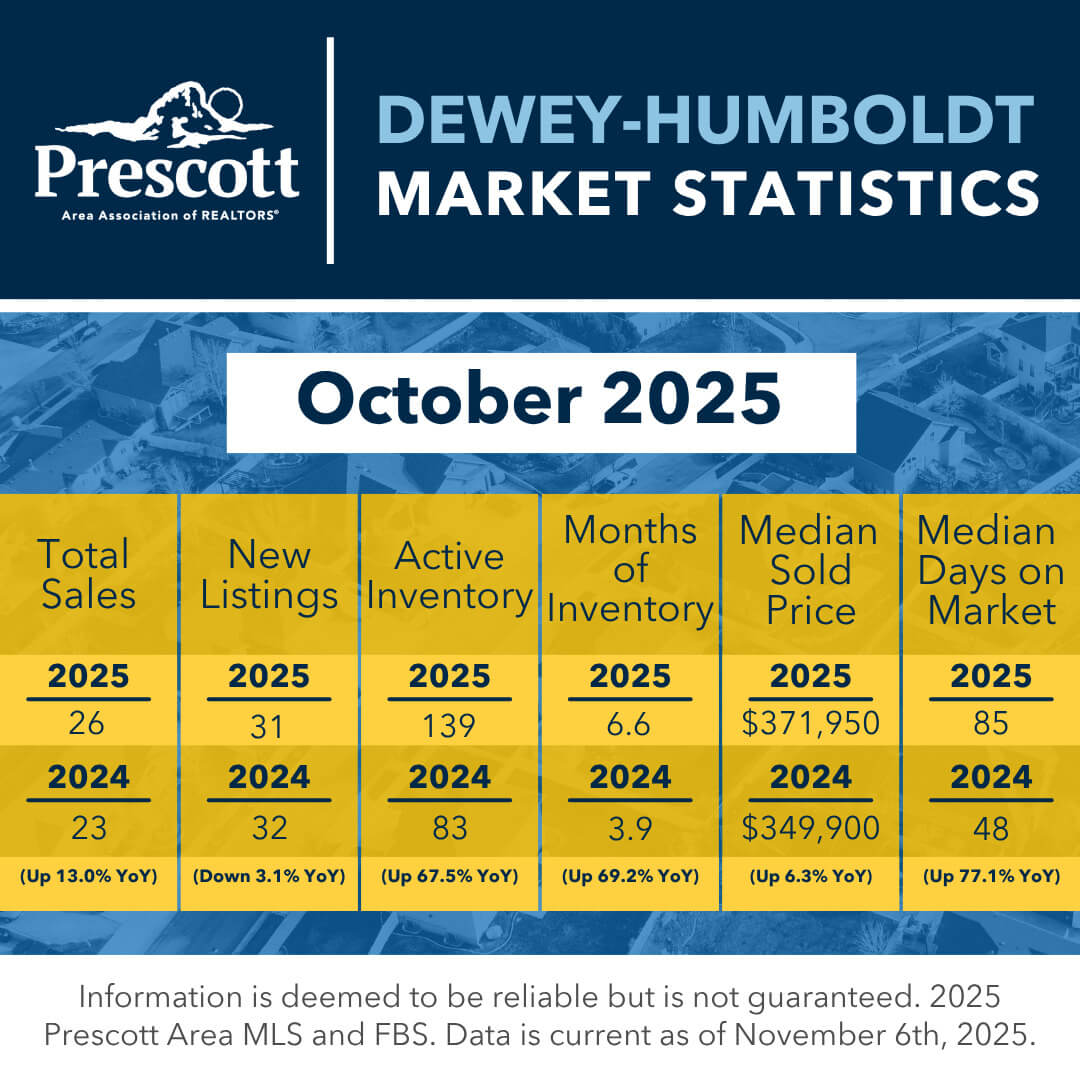
Understanding the unique Dewey-Humboldt market dynamics
Year-to-Date: What the Broader Data Shows
Looking at Prescott area home sales from January through October 2025, the data reveals:
- 3,088 total sales across all of PAAR (up 34.1% from 2024)
- 5,171 new listings hitting the market (up 21% from 2024)
- Median home price of $475,000 (down slightly by 2.1% from last year)
- 41 median days on market—unchanged from 2024
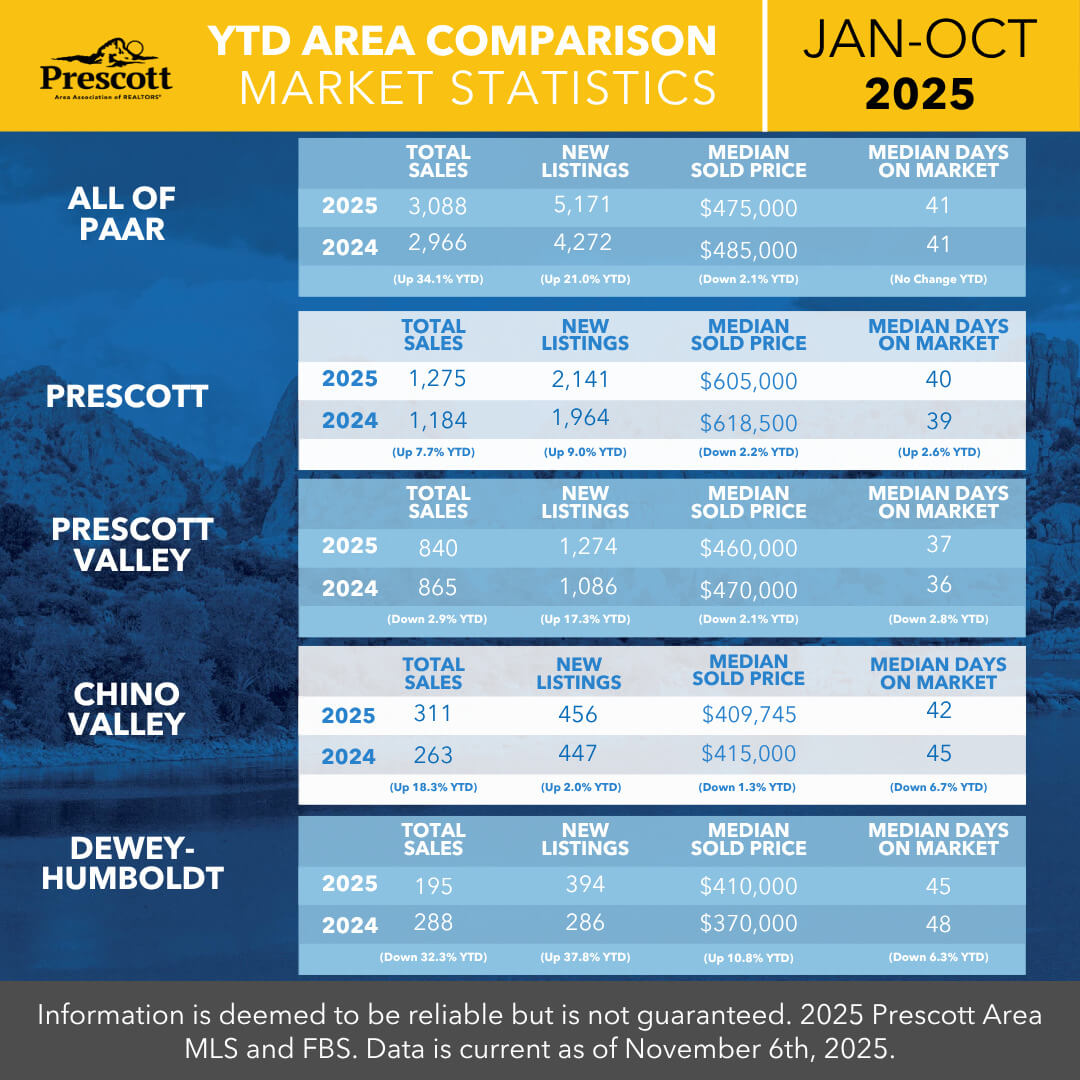
Year-to-date trends show the bigger picture across all markets
What this data suggests: More homes are selling, but at slightly lower prices than last year's peak. The market statistics show more inventory, which appears to be giving buyers more choices while still maintaining healthy demand. This is what real estate professionals often interpret as a "normalization" and it could indicate improved market stability.
What These Northern Arizona Housing Market Trends Could Mean for 2025-2026
Based on these Prescott real estate trends, here's what the data appears to be indicating:
For Buyers:
✅ You may have more negotiating power
✅ More inventory could mean less competition
✅ The data suggests you might be able to take time to find the right home, not just a home
✅ Market conditions indicate sellers may be willing to negotiate on price, closing costs, and contingencies
For Sellers:
✅ Homes are still selling—data shows demand hasn't disappeared
✅ Statistics suggest that properly priced homes in good condition are moving steadily
✅ Current trends indicate you may need a strong marketing strategy and patience
✅ The data points to working with an experienced local agent being more important than ever
For Investors:
✅ Data suggests looking at Chino Valley for potential growth
✅ Prescott proper appears to remain a stable investment based on trends
✅ Market indicators suggest rental demand remains strong across all areas
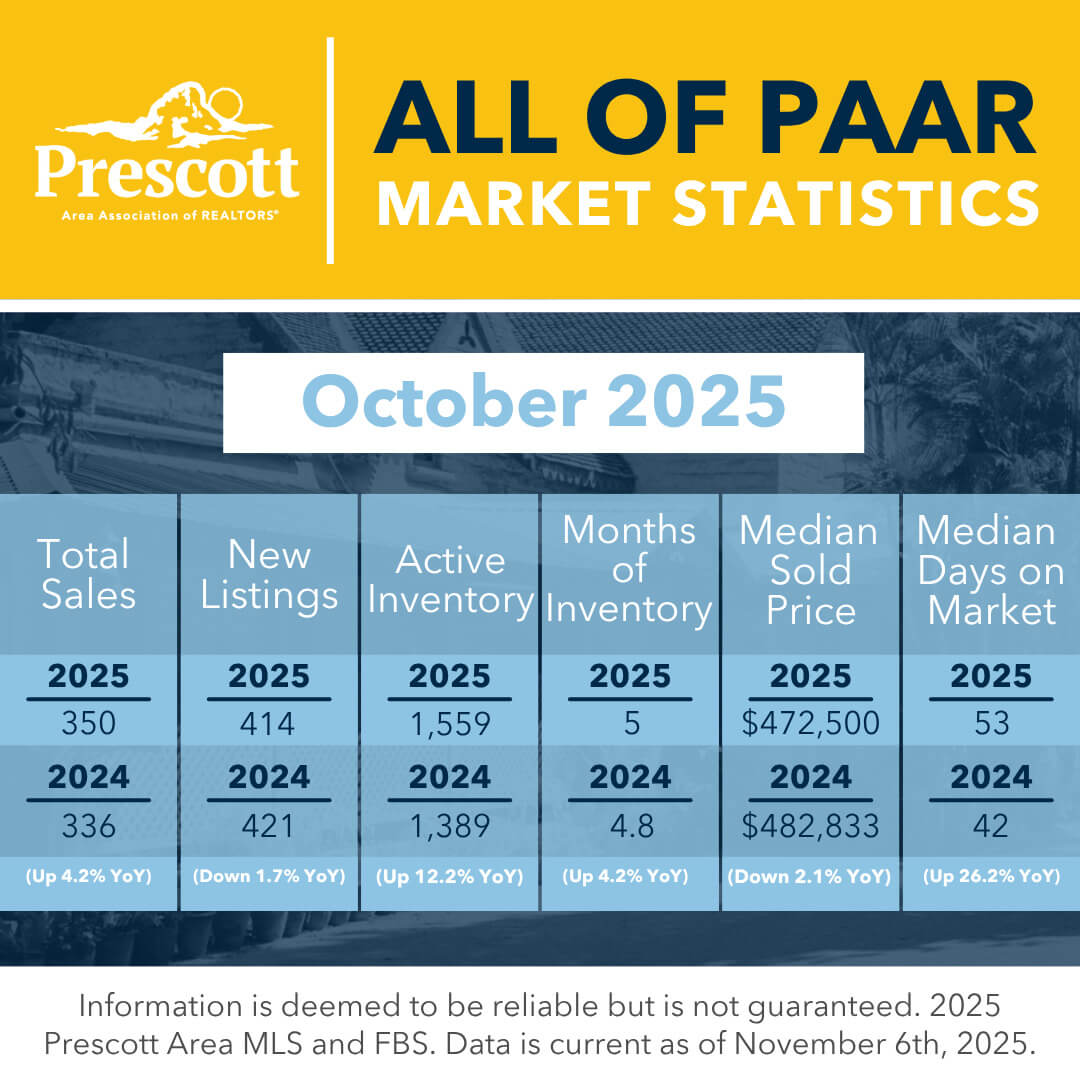
The complete picture of the entire Prescott area real estate market
The Bottom Line on Prescott Area Real Estate
The Prescott Arizona housing market data doesn't show a crash, it appears to be maturing. After years of intense seller's market conditions, the statistics suggest we're settling into what could be a more balanced environment where both buyers and sellers may find opportunities. Different neighborhoods are experiencing different dynamics, which means working with a local expert who understands these nuances could be critical.
Whether you're looking at Prescott Valley homes for sale, dreaming of a Chino Valley property, or eyeing luxury real estate in Prescott, understanding these market statistics may help you make more informed decisions.
Ready to Make Your Move?
The October 2025 market data suggests that opportunity may exist on both sides of the transaction but the statistics indicate that strategic planning and local expertise could make a significant difference.
Want to understand what these trends might mean for your specific situation? Whether you're buying your first home, selling to upgrade, or exploring investment opportunities in the Prescott area, let's discuss how to navigate this market with confidence.
Contact Legacy Real Estate Network Powered by PLACE, Keller Williams Arizona Realty today to get personalized insights into the Northern Arizona real estate market and explore how these statistics could inform your real estate decisions.
Information is deemed to be reliable but is not guaranteed. 2025 Prescott Area MLS and FBS. Data is current as of November 6th, 2025.
or another way